Showing posts with label Fractal. Show all posts
Showing posts with label Fractal. Show all posts
Saturday, October 16, 2010
Benoit Mandelbrot passes away at 85, RIP
From the New York Times,
"In the 1950s, Dr. Mandelbrot proposed a simple but radical way to quantify the crookedness of such an object by assigning it a “fractal dimension,” an insight that has proved useful well beyond the field of cartography.
Over nearly seven decades, working with dozens of scientists, Dr. Mandelbrot contributed to the fields of geology, medicine, cosmology and engineering. He used the geometry of fractals to explain how galaxies cluster, how wheat prices change over time and how mammalian brains fold as they grow, among other phenomena.
His influence has also been felt within the field of geometry, where he was one of the first to use computer graphics to study mathematical objects like the Mandelbrot set, which was named in his honor.
“He doesn’t spend months or years proving what he has observed,” said Heinz-Otto Peitgen, a professor of mathematics and biomedical sciences at the University of Bremen. And for that, he said, Dr. Mandelbrot “has received quite a bit of criticism.”
“But if we talk about impact inside mathematics, and applications in the sciences,” Professor Peitgen said, “he is one of the most important figures of the last 50 years.” "
See also "The Thumbprint of God".

Monday, June 4, 2007
"The Thumbprint of God"

Arther C. Clarke explores the Mandelbrot set in this fantastic hour long documentary. Click on the link above for full screen or watch the video as sized below.
There are many free programs on the web for exploring the Mandelbrot set, here is one.

For the details of the calculation, this site has a nice simple explanation. That link is also where I got these beautiful images that seem... well, like they could be the fingerprint of a god.
I'll be on vacation for the next few weeks, so expect something inspired when I get back!
-pythagoruz
Sunday, May 20, 2007
Simplicity in Chaos: The Logistic Map
 When most hear the word chaos it conjures up thoughts of disarray, confusion and complexity. Webster defines it as "a state of things in which chance is supreme, especially the confused unorganized state of primordial mater before the creation of distinct forms and the inherent unpredictability in the behavior of a complex natural system (as the atmosphere, boiling water, or the beating heart." The beating heart!? But its also one of those everyday words that has been taken by science to name a theory in a more visual or mnemonic way, like string theory and for many years it was the leading edge of math and physics. Chaos Theory was the buzzword of the 1990's, but it has since been replaced by nanotech or solar energy. You must remember in Jurassic Park (also a film) how the lawyers had to call in the genius chaos theorist to give the dinosaur resurrection the go ahead. Well they didn't listen the chaos guy and well, things went to... chaos.
What is amazing to me, and a foundation of chaos theory, is that simple (albeit nonlinear) systems with simple laws can lead to extremely complex and "chaotic" results. In many cases these simple systems only lead to complex solutions under certain conditions, under other conditions they might yield a single simple answer.
 It seems to me that popularized fractals like the Mandelbrot Set(seen at right), the Koch Snowflake and the Sierpinski Triangle are mappings of the region between order and chaos. Not only are these maps extremely interesting from an academic standpoint, they have an inherent beauty that stretches to infinity.
  You can literally zoom in to these maps infinitely and find at least as much depth as the macroscopic view and in many cases much more. There is nothing else like them in the universe. Lets say you were looking at the galaxy from afar, you could zoom in further and further, but eventually you would hit a brick wall called the atom (or would you...). Evey thing we know has a limit, even physicists agree the universe is finite in size, although Einstein called it "infinity with bounds." Einstein was referring to the idea of the universe being finite but not having an "edge," a different idea, but the phrase still seems appropriate for the Logistic Map.
The logistic equation has been around since 1845 when it was developed as a method for modeling population growth, in fact you probably learned about it at some point if you know what a differential equation is. It basically assumes that the rate of population growth is proportional to the population but growth slows and stops as the population reaches the carrying capacity (maximum population). Maybe the equation itself will job your memory, from mathworld (also the top image):
 While solving this equation might require some practice, it is fundamentally quite simple and based on some simple ideas. Actually, the logistic equation does not produce chaotic behavior. That is until the mid 1970's when Mitchell Feigenbaum (an interesting guy by the way) discovered that logistic equation could be modified to demonstrate strange behavior in some physical systems he was studying.
If you take the right side of the logistic equation and for a given value of r (rate constant) between 0 and 4, plug in an x value to give the next value of x. In other words, iterate the equation repeatedly using its previous value to give the next value. The initial value of x is another parameter that can be played with, but .4 works well. You just iterate this equation:
 Yes, thats it.
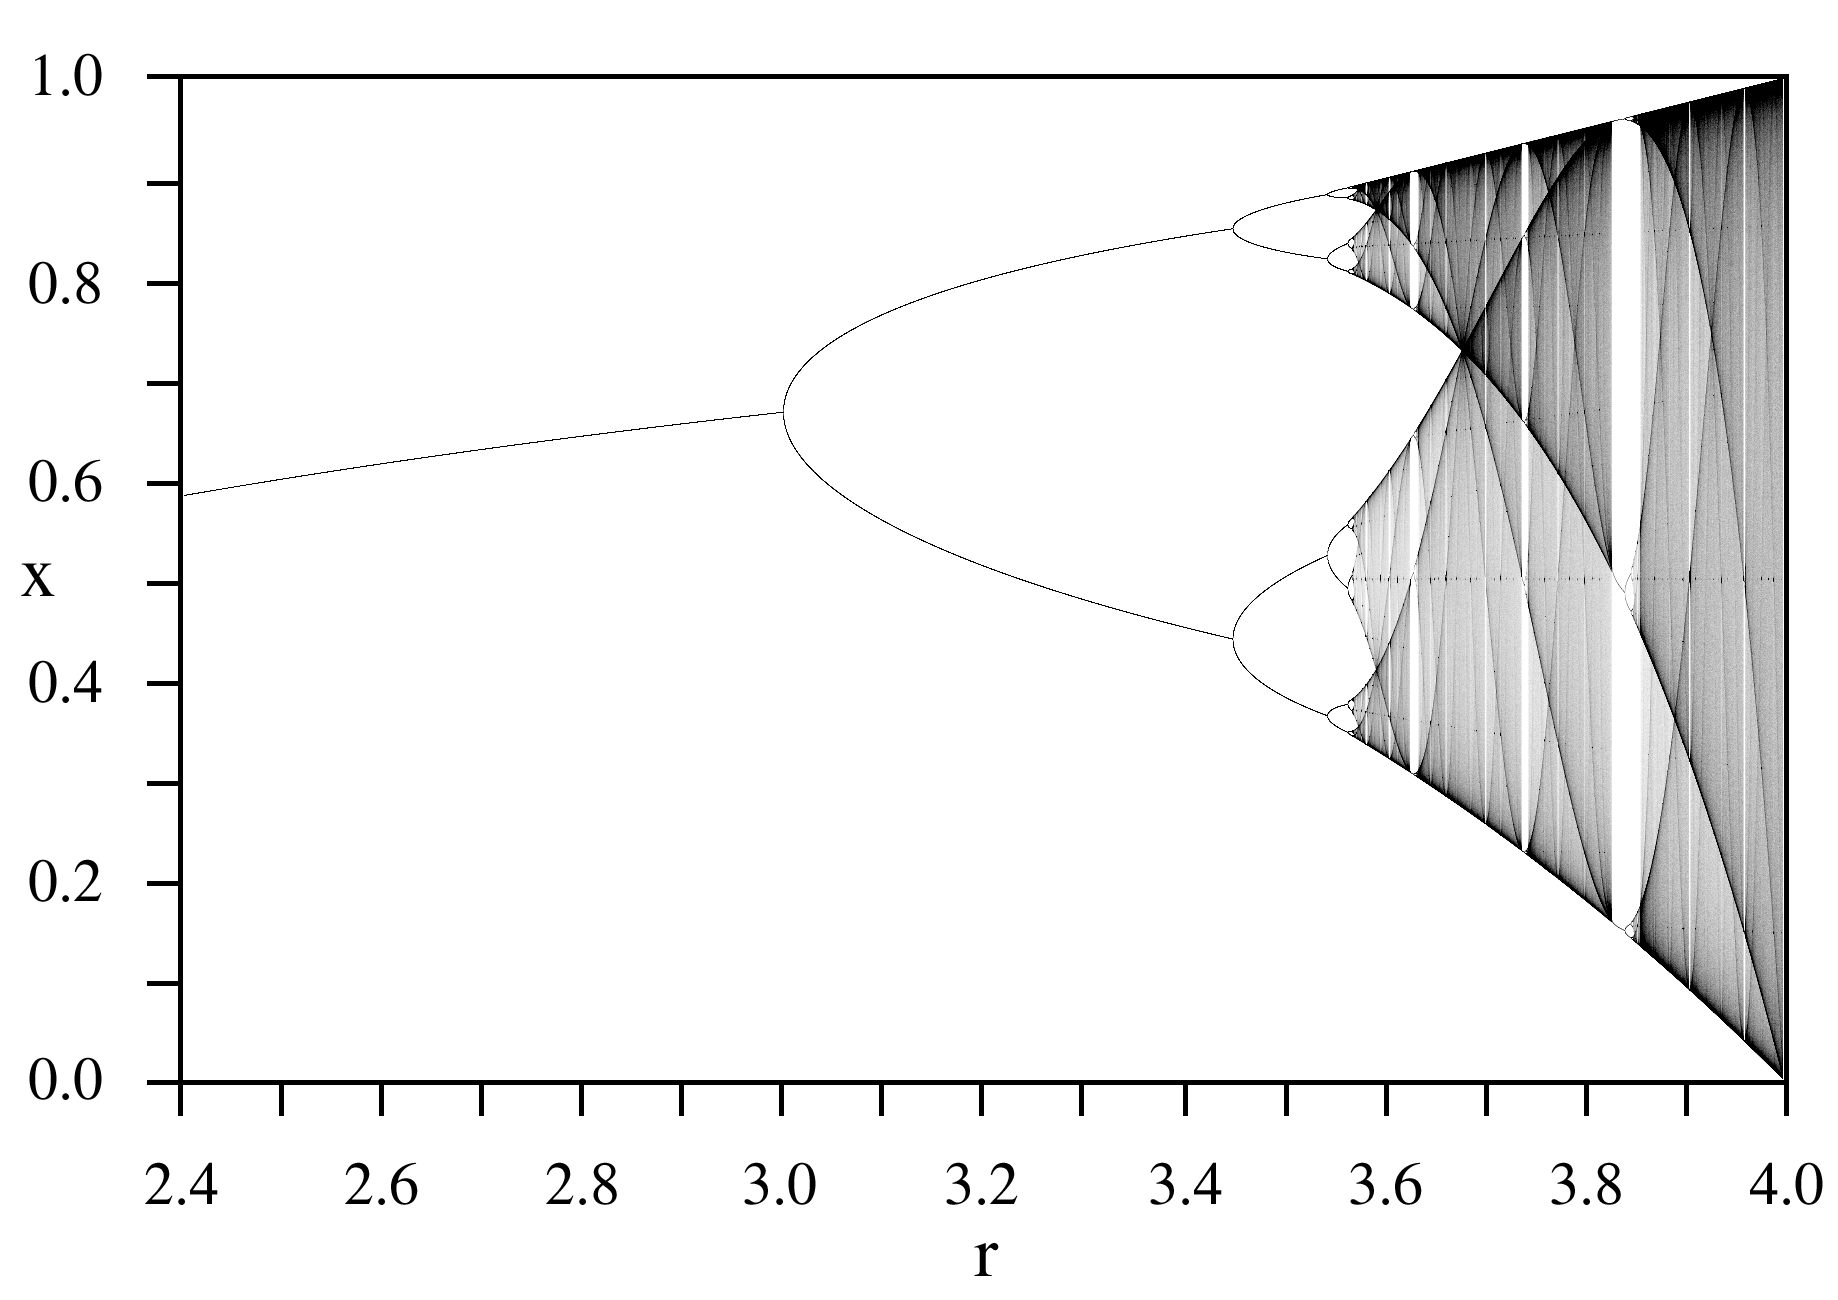
The behavior is entirely dependent on the rate constant, defined for each iteration. For some values of r, like r is less than 1, the equation tends towards zero. For other values, for example r above 1 but less than 3, the value of x bifurcates and tends to two stable values, oscillating between them after a large number of iterations. As the rate constant increases further the system (x value ~ population) splits into 4, then 8 stable values of x. At some point the stability breaks down and they system no longer tends towards any given value, it has become chaotic. Plot all the values that the system yields after 50 or so iterations and you get the logistic map:

What I find so amazing about this system is how simple the rules are. Take this function to modify a value of x and plug the result back into the equation. Now its not your normal approach to dealing with an equation, but it is simple. Some savvy electrical engineers have come up with an equivalent circuit to the logistic iteration, the output is shown below. I'm not sure how profound this really is, but it certainly suggests that some systems may be orderly under the right circumstances while the same system will be chaotic and completely unpredictable under other conditions... Hmm, that sounds alot like the stock market.

Subscribe to:
Posts (Atom)